For open-ended questions, it’s easy to underestimate the number of plausible outcomes. For instance, while practicing for the forecasting class, the course staff were asked to predict the following question:
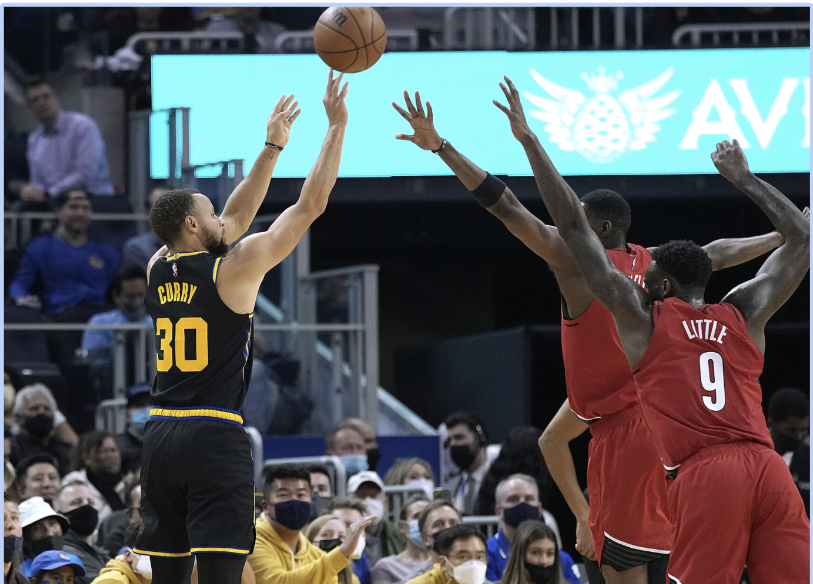
Which NBA player will have the highest average points per game (PPG) between October 20th and October 27th?
Tip
Before continuing to read, think through how you would answer this question.
To answer this question, I thought about star players who were top scorers, and also looked at who had high PPG in the previous season. The names I came up with were Giannis Antetokounmpo, Steph Curry, Luka Doncic, Kevin Durant, and LeBron James, so I made the following forecast:
Giannis 19%
Curry 17%
Doncic 16%
Durant 13%
LeBron 12%
Other 23%
In fact, the top scorer was Ja Morant, and the second highest scorer also wasn’t on my list. In retrospect, 23% on “other” was a pretty bad prediction, and I should have put more like 60-70% on “other”.
This is a general challenge with forecasting when the set of options is large. Even if each individual choice in the “other” category isn’t that likely, there are a lot of choices in that category, and they add up to a large number. For instance, there are 30 teams in the NBA, so even counting just the best player on each team, my top-5 list was missing 83% of the options. Even if the other 25 starters were each only half as likely as LeBron to top the PPG, they would account for 66% of the probability mass.
Our tendency to underestimate “other” is worsened by the narrative fallacy, which is our cognitive tendency to frame events in some logical coherent order, and the disjunction fallacy, where the whole is often estimated to have lower probability than the parts. It’s easy to imagine Curry scoring lots of points, but harder to imagine Ja Morant (although he is quite good), and even harder to imagine “some random player” scoring a lot.
On the other hand, there are times when “other” really does have a low probability. For instance, in a given week there’s really only 1 or 2 movies that have a real chance of topping the box office returns.
Since deciding the right probability for “other” is surprisingly difficult, it’s worth practicing as a distinct skill. In this post, I’ll discuss two ways of handling it: (1) the MECE principle, and (2) reasoning about variance. I’ll also end with some quotes from Misha Yagudin, a top-ranked forecaster, on good cognitive strategies for handling “other” options.
7.1 The MECE Principle
The MECE principle, which stands for “mutually exclusive and collectively exhaustive”, is a special case of decomposing the problem. It’s pretty much what it says: write down a set of options that exhausts the set of possible outcomes, and come up with a probability for each one.
At face value, this would mean not having an “other” option at all, but this is usually impractical—we’re not going to assign a probability for all 450 players in the NBA. But even so, MECE can be useful. For instance, realizing that there were 30 teams (and hence 30 “best players”) highlighted that the top 5 options didn’t cover much of the space.
MECE for NBA Prediction. If I were to apply MECE to the NBA prediction, I’d break it down as something like:
5 “super-scorers”
25 other “best players”
30 “second-best players”
~120 other players who get “significant playing time”
~270 “bench” players who get limited playing time
Let’s use these options to compute the average probability that a “super-scorer” tops the PPG. First, let’s focus on only the first two options. To make some numbers up, maybe I think each super-scorer is on average 3x as likely to top the PPG as the other 25 best players. To turn this into a probability, we’ll add up the possibilities, use the fact that the probabilities sum to 1, and work backwards. This means that the average probability that a “super-scorer” tops the PPG is:
Code
super_scorers_weight =1other_best_players_weight =1/3# "super scorers" are 3x as likely to top the PPG than the other "best players"sum_weights =5* super_scorers_weight +25* other_best_players_weight # total weight p =1/sum_weights # average probability that a "super-scorer" tops the PPG print(round(p, 3))
0.075
The total probability that any “super-scorer” tops the PPG is:
Code
print(round(5* p, 3))
0.375
Let’s suppose we also include the next category: “second-best players”. To make some numbers up again, maybe I think that on the average the 30 best players are 4 times as likely to top the PPG than the next 30 “second-best players”. Then, the total probability any “super-scorer” tops the PPG would further decrease to:
Code
second_best_players_weight =1/4# "second-best players" are 1/4th as likely as the top 30 best players to top the PPGnew_sum_weights = sum_weights + sum_weights * second_best_players_weight p_new =1/ new_sum_weights # new average probability that a "super-scorer" tops the PPGprint(round(5* p_new, 3))
0.3
In actuality, the other 120+270 players have some probability mass. Maybe the third-best players are 10% as likely, the fourth-best players are 4% as likely, and so on. This collectively doesn’t add much.
(This all glosses over the fact that the different players’ points-per-game are not independent of each other, and thinking about this would probably change the answer a bit, but hopefully this illustrates the idea.)
MECE for box office scores. As another example, let’s apply MECE to predicting which movie tops the box office this weekend (the weekend of Nov. 13th, 2021). If I go to reddit.com/r/boxoffice, I see that there are around 10 choices: Eternals, Clifford, Dune, Belfast, No Time to Die, Venom, Ron’s Gone Wrong, The French Dispatch, Spencer, and Antlers.
Most people in the predictions thread are predicting Eternals at around $25M, Clifford around $12M, Dune at $5M, No Time To Die at $4M, and the rest below that. It’s hard for me to imagine these being off by a factor of more than 5 (if I were being careful I’d check that historically that basically never happens), so it would be safe to assign probabilities to Eternals, Clifford, and Dune, and place everything else at something pretty small in total (maybe even as small as 1%, or a bit higher to account for the probability that I misread the list).
MECE is nice because it correctly demonstrates that the NBA prediction should place lots of probability on “other”, and the box office prediction not so much.
Comments from Misha
On MECE — I think it’s an excellent approach whenever it works. For it to work, you need to be able to enumerate space of possibilities or approximate it somehow. I think your examples are good and helpful.
7.1.1 MECE + Programming
The other way to apply MECE to NBA prediction would be to come up with a simple heuristic to predict the probability, and then write a script to compute it for all the players. Even if the heuristic ignores a lot of specific relevant details, it will probably be okay on average and so give a good estimate of the relative magnitude of “other” vs. the top 5 or 10 options.
For the NBA example, I could grab the list of each player’s scores from the previous season, look at all the weeks, and see how often each player comes up on top. This will miss differences across seasons (such as injuries or player improvement) and miss specifics of the upcoming week and probably several other factors, but this probably affects the “other” and “top scorer” categories roughly similarly and will give a reasonable estimate of the ratio.
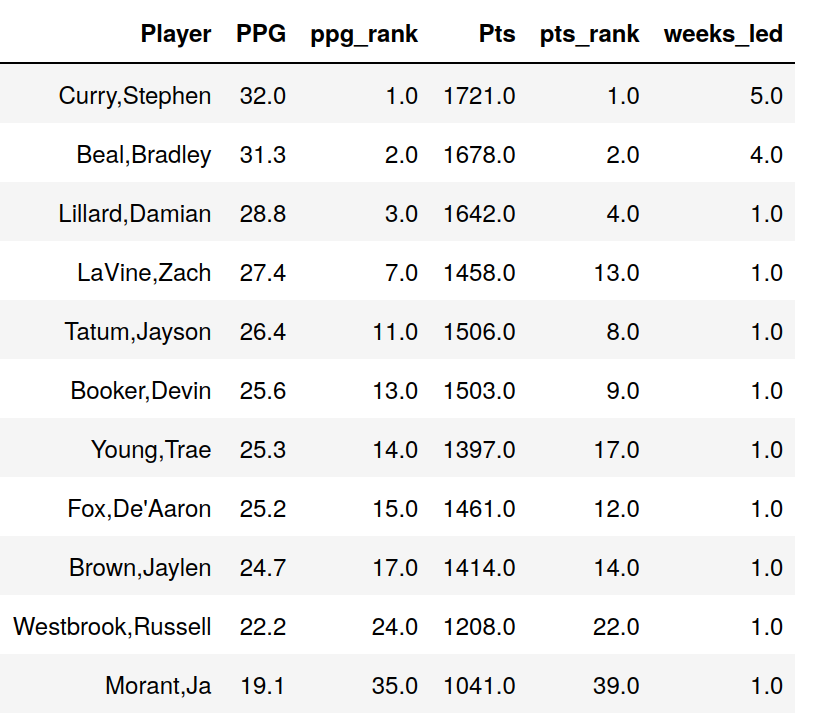
I in fact ran this script for the first 18 weeks of the 2020-2021 season, and here are the results:
I listed each player that led scoring for at least one week, and also included their season total points/game (PPG) and points (Pts), as well as how they ranked among all players.
Out of 18 weeks, the top 2 scorers (Curry and Beal) led 5 and 4 times each. But the 3rd scorer (Lillard) led only once, and none of the other weekly leaders were in the top 6. To cover all 18 weeks, you’d have to go down into the 30s.
This implies that historically, if you had listed the top 6 players, you would have missed 8/18 = 44% of weeks. But this top 6 list has the benefit of hindsight at the end of the season, whereas in our case we were predicting a new season and should have more uncertainty. So this is consistent with the 60%-70% estimate for “other”.
7.2 Noise and Power Laws
Another approach would be to think about how noisy a player’s point total is for a given week, and how that compares to the difference in points across players. For the latter, here were the top 3 scorers for the first 3 weeks of January 2021:
Date
Rank
Player
Pts
2021-01-04
1
Curry,Stephen
149
2021-01-04
2
Brown,Jaylen
137
2021-01-04
3
Tatum,Jayson
135
2021-01-11
1
Beal,Bradley
135
2021-01-11
2
LaVine,Zach
133
2021-01-11
3
Hayward,Gordon
117
2021-01-18
1
Lillard,Damian
133
2021-01-18
2
Durant,Kevin
132
2021-01-18
3
Dončić,Luka
113
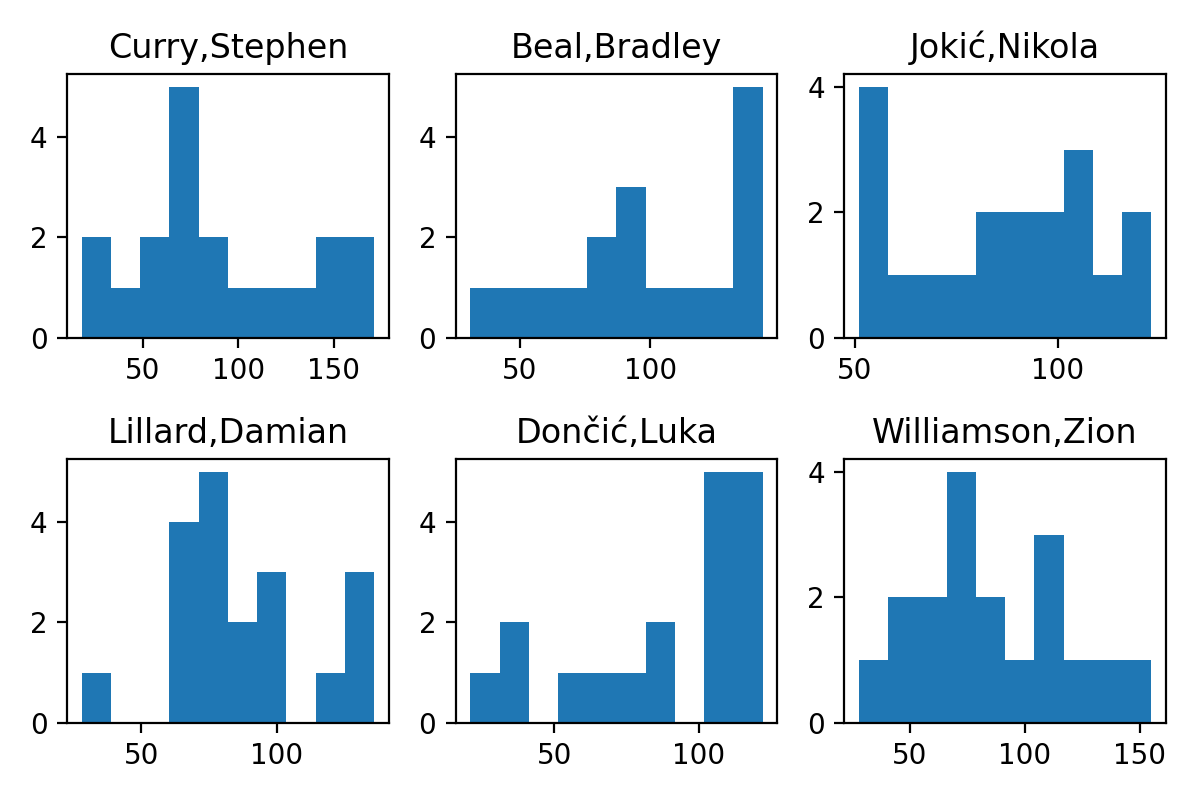
The winner was decided by 12, 2, and 1 points, respectively. On the other hand, here is the variation in weekly points for the top 6 scorers in the NBA:
The standard deviation is huge, around 30 points. This immediately tells us that there are a lot of people who “could” win in a given week. Since there are 3-4 games in a week, anyone whose average points/game is within 7.5-10 points of the leader is within 1 standard deviation. This comes out to ~17-25 players. If we compare to our earlier result, 16/18 of the weekly leaders were in the top 17 PPG, and 17/18 were in the top 25, so this is the right ballpark for the set of “plausible” options.
Comments from Misha
I am not knowledgeable about the NBA. One thing which strikes me immediately: the time interval is short, the variance will be huge; this is on top of basketball being a fairly high variance game in general.
Each player’s points in a given week is probably Gaussian-ish (very unlikely to exceed 200, so more like heights than Twitter followers).
But the points per game as distributed across players is more like a power law: a small number of players score most of the points, but there’s also a long tail.
The power law intuition tells me that once we start going into the tail, we’ll have to go pretty far before we run out of options. The difference between the 2nd and 3rd ranked scorers (Beal and Lillard: 31.3 vs. 28.8) is the same as the difference between the 10th and 20th ranks (Tatum and Ingram: 26.4 vs 23.8)
7.3 Cognitive Tricks for Remembering “Other”
One explanation for why we tend to forget “other options” is cognitive biases. Misha Yagudin proposes what cognitive biases might be contributing to this.
Comments from Misha
“You bring up misc cognitive biases. My default explanation would be availability bias. Per wikipedia: ‘Availability bias, is a mental shortcut that relies on immediate examples that come to a given person’s mind when evaluating a specific topic, concept, method or decision.’”
For remembering “other options”, math can build useful intuition, but what’s probably more important is good mental heuristics.
Comments from Misha
“It’s quite often helpful to ask: ‘huh, could I forget about another option which will sound plausible’ — I usually do it for open-ended questions, and it helps me moderate my guesses.
A good example is any trivia, an open-ended question. After thinking more about my calibration, I started annoying people by saying that I think the answer is X with a probability of like 20%. They expect certainty and, unfortunately, don’t update on both of us betting on wrong answers.”
Other options occur everywhere. Finally, Misha points out that it’s often useful to think about other options even for questions that appear to have a small choice set (e.g. yes/no questions):
Comments from Misha
“I would say that the ‘other’ option appears more often than people think, as your post implies.
Fairly often, I use the above heuristic while doing geopolitical forecasts. For geopolitical forecasts, it’s sometimes helpful to try to get a better world model and outline plausible scenarios. But this is faulty as one might oversubscribe to a particular scenario.”
One of the most satisfying forecasts I’ve ever made was about whether Saudi Arabia would cancel Hajj because of coronavirus. The question’s framing promoted black and white thinking, and just asking whether there could be other solutions led us to come up with a few which were plausible (and which, imo, would better satisfy stakeholders).
So asking ‘could I not think about something which will sound plausible’ is very helpful!”