12 Prioritizing Information
So far, we’ve focused on individual skills involved in a forecast: extrapolating trends, employing reference classes, how to combine estimates, and thinking about alternatives. Next, I want to turn to integrating these, and other skills, when making complex forecasts. We’ll consider the following question (worked through on Dec. 21st, note the Metaculus question closed Dec. 1st):
When will the UK’s pre-March 2022 peak 7-day moving average of current COVID hospitalizations occur?
This question has many considerations and moving parts, and we’ll need more than one lecture to get to all of them. For this lecture, I’ll be focusing on the skill of prioritizing information. This involves:
- listing key considerations (step 1),
- ranking them by their importance and uncertainty (step 2), and
- following up to resolve the uncertainty (step 3).
From this we’ll end up with a rough point estimate, but not a full probability distribution. In the next lecture I’ll focus on how to combine all the considerations together into a full probabilistic forecast.
As usual, I’ll also include comments from Misha Yagudin (a top-ranked forecaster).
For reference, here are case counts in the UK and South Africa as of Dec. 21st:
12.1 Step 1: Listing Key Considerations
When approaching a complex forecasting question, it’s useful to start by listing as many relevant considerations as you can think of. Here is the list I came up with for the UK Omicron question (ordered by when I thought of them, not by importance):
- Hospitalizations lag cases by ~9 days
- The peak of the 7-day moving average will occur 3 days later than the single-day peak
- Holidays or other mass gatherings could affect the peak
- We can forecast by guessing max # of people infected together with Omicron doubling time and current case numbers.
- Max # of people infected: Will the UK adopt dramatic NPIs to curb omicron, or do nothing? Or will people’s individual precautions slow the curve? (Note: I generated the 3rd option by thinking about “other” options.)
- NPIs: max # infected roughly equal to hospital capacity
- Do nothing: max # infected roughly equal to herd immunity
- Slow the curve: trickier, something in between
- Omicron doubling time: ~4 days?
- Current case numbers: no clue, can probably estimate from known data
- Max # of people infected: Will the UK adopt dramatic NPIs to curb omicron, or do nothing? Or will people’s individual precautions slow the curve? (Note: I generated the 3rd option by thinking about “other” options.)
- Seasonality effects are probably important
- What are UK leader’s current stance towards NPIs?
- “Other” option brainstorming: What if hospitals are at capacity for an extended period of time and so there’s no clear “peak”?
Do you agree with the above ratings? For any considerations you generated, how would you rank their importance and uncertainty?
12.2 Step 2: Prioritizing Considerations
Once you have a list of key considerations, it’s helpful to rate each one by how important it is, and how uncertain you are. This way you can focus follow-up research on questions with both high importance and high uncertainty. I listed my rating of this for the UK Omicron question below:
| Consideration | Importance | Uncertainty |
|---|---|---|
| Hospital lag | High | Low (fairly sure it’s 7-11 days) |
| 7-day lag | Medium | Very low |
| Holidays | Medium (xmas and ny important but likely before peak) | Medium (don’t know much about UK holidays) |
| Strong NPIs or no | High | High |
| Omicron doubling time | High | Medium (2-5 days?) |
| Current cases | High | High |
| Seasonality | High | High (use last year as reference class, know it peaks in January but not sure exactly when) |
| UK leader stance | Medium-Low (could easily change) | High |
| Extended peak | Medium (short generation interval makes this unlikely) | Medium |
Do you agree with the above ratings? For any considerations you generated, how would you rank their importance and uncertainty?
Based on the above list, there’s three considerations with high importance and high uncertainty: whether the UK adopts strong NPIs, current case counts, and how seasonality is likely to affect the peak. There’s also one consideration with high importance and medium uncertainty: omicron doubling time. The next section of this post will focus on reducing each piece of uncertainty, using the tools we’ve developed in previous lectures.
I myself would probably spend more time looking into “how did the last peaks go.” Primarily to have a better world model and be less confused about the issue.
Apart from importance and uncertainty, what other factors might you want to consider to prioritize considerations?
12.3 Step 3: Reducing Uncertainty
12.3.1 Strong NPIs or not
Thinking about this more, the relevant question is actually Will the number of Omicron cases be more closely dictated by hospital capacity or by herd immunity? This is because our strategy is to forecast the peak in terms of the doubling time and max number of cases, so the case maximum is the decision-relevant quantity.
Let’s first estimate how many people would need to get infected to reach (1) herd immunity or (2) hospital capacity. Note the UK has 68 million people in it.
Herd immunity. We start by Fermi estimating the number of people who need to get infected to reach herd immunity. Suppose we reach herd immunity when 70% of people have either gotten Omicron or are immune. We’ll first calculate existing levels of immunity:
- 30% of UK is doubly-vaccinated (but not triply). Each double-vaxxed person is ~40% (? rough guess, had trouble finding number) immune from Omicron.
- 40% of UK is triply-vaccinated. Each such person is ~70% (?) immune from Omicron.
- 15% of UK has gotten previous strain via confirmed case, would guess more like 30%-40% accounting for undertesting. Some overlap with vaccinated populations, but let’s say this adds another 15% of people who are 25% immune.
This leads to 0.3 * 0.4 + 0.4 * 0.7 + 0.15 * 0.25 = 44% currently immune. So herd immunity implies another 25% or 17 million people getting Omicron.
Hospital capacity. We will estimate the number of people who need to get infected to reach hospital capacity using two methods:
Fermi estimate: The UK has 100,000 acute hospital beds (looked up on Google). People stay in hospital for about a week, so max hospital load governed by peak cases in ~1 week. Would guess hospitalization rate is 1-2% (was 4% for original strain, should be lower now because of vaccinations + prior infection + slightly lower severity, but Omicron infections will skew towards unvaccinated and vaccine effectiveness is waning). If we go with 1.5%, then 6.7 million infected would reach hospital capacity. (In reality less than that because some beds needed for other purposes, but there will also be additional infections in the weeks before/after.)
Reference class: We can alternately use the UK’s previous January wave as a reference class. The UK had 40,000 patients in the hospital at the last peak (looked up on OurWorldInData), with 60,000 confirmed cases/day and 2.4 million cumulative confirmed cases over the course of the wave. I’d guess the UK lets 2-3x as many people get sick in this wave before taking drastic action, due to a combination of (1) lower severity, (2) faster growth takes policymakers more by surprise, and (3) fatigue around NPIs. Also, if last January was a good reference class then going more than 5x would surely overwhelm hospitals. If we take 2.5x as our point estimate, this leads to 6 million infected.
Conclusion. Both hospital capacity estimates suggest around 6-7 million cases. Herd immunity would seem to require exceeding hospital capacity by a factor of 3, which seems possible but unlikely. My takeaway is a point estimate of 6.7 million and a 70% confidence interval of [2.4 million, 13 million].
12.3.2 Seasonality
We know from experience that Covid tends to peak in the winter, due to a combination of holiday celebrations and people being inside more. This is a good use case for reference class forecasting, where we can look at seasonal effects in various countries last year:
The peaks were: Jan. 8 (US), Jan. 9 (Canada), Jan. 9 (UK), Jan. 26 (Spain), Dec. 23/Jan. 9 (Germany), Nov. 13/Jan. 10 (Austria), after January / not super clear (France). This generally suggests sometime near Jan. 9 with a possibility for significantly later (Spain) / something weird (France).
Let’s also consider hospitalizations:
The peaks were Jan. 5 (Netherlands), Jan. 12 (Canada), Jan. 14 (US), Jan. 18 (UK), Feb. 1 (Spain), no clear peak / pre-December peak (France, Italy, Belgium, Austria).
These graphs were a bit weirder than the graphs of cases, although I’d still be somewhat surprised if the UK didn’t have some sort of clear peak (even if it’s an extended peak) in late December / early January.
Conclusion. Overall, I think seasonality would point towards a peak in mid-January.
12.3.3 Current Cases
Based on OurWorldInData, the UK had 83,000 confirmed cases on Dec. 20th:
Based on the pre-Omicron counts, it looks like at most 45,000 of those would have been from Delta. If I try to add up over all the days (subtracting off ~45,000/day for Delta), I get around 200,000 Omicron cases so far.
12.3.4 Omicron Doubling Time
Let’s start with Google:

That suggests 1.5-3 days, but I’m not prepared to take this on face value because (1) news has an incentive to sensationalize, and (2) initial doubling time has tended to slow down in past waves.
Let me try a few more sources. I googled “omicron doubling time Eric Topol” (since Eric is one of my more trusted sources) and got this graph from one of his tweet threads:
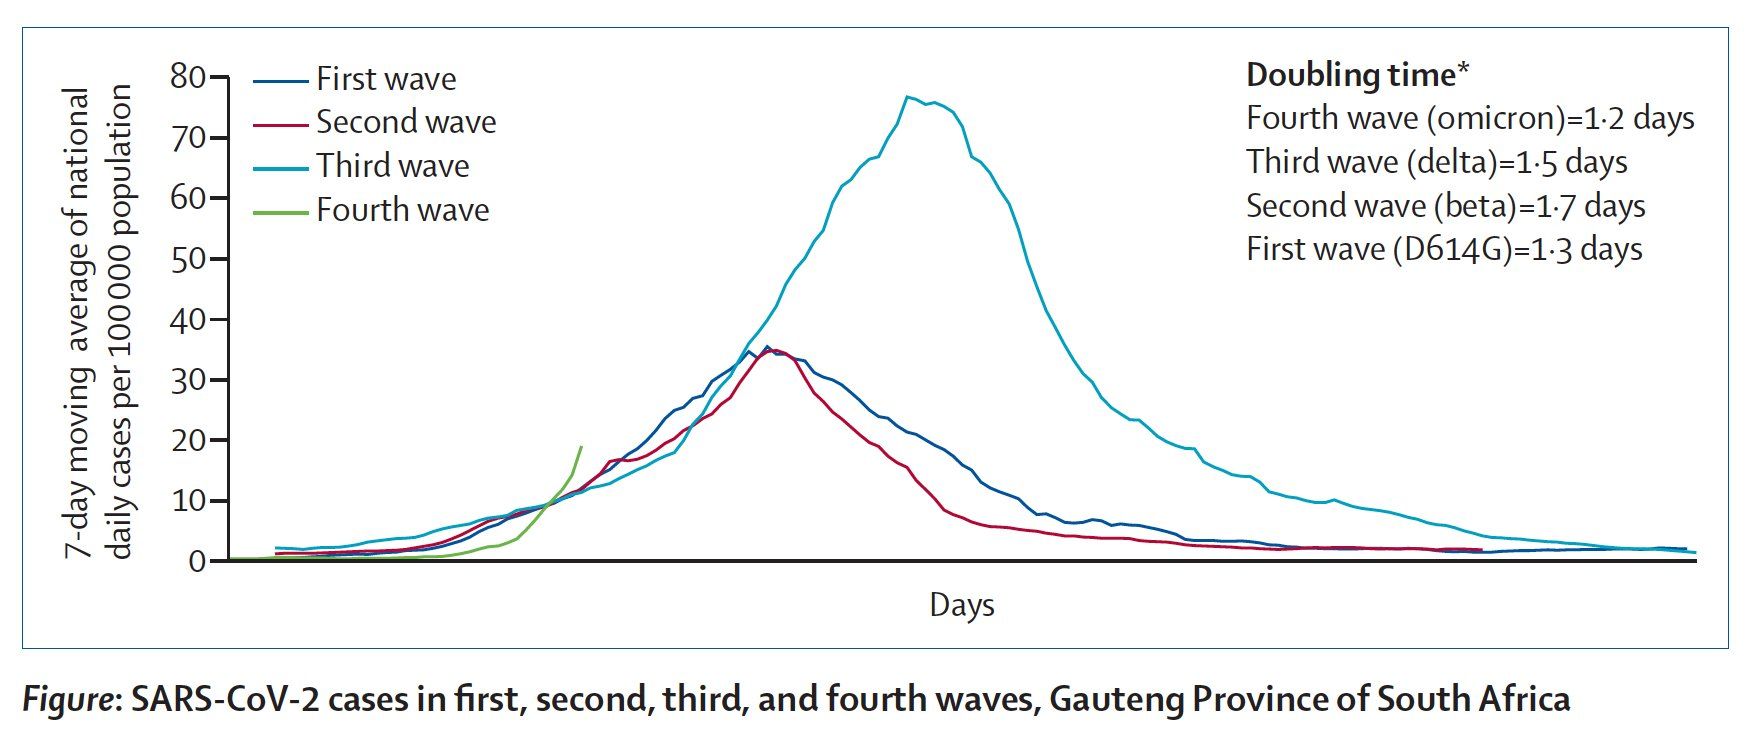
This graph says 1.2 days but thinks Delta had a doubling time of 1.5 days, which didn’t match my experience. Eric’s recent op-ed says “2-3 days”. So perhaps 2.5?
Trevor Bedford actually shows his work and says 2.3-3.3 days. Says UK is currently at 2.3 days doubling time.
Should I expect this doubling time to hold into the future? On the one hand, higher precautions = slower doubling; on the other hand, Christmas celebrations = faster doubling. I’m not sure which will win out so let’s use last year in the UK as a reference class. I’ll start at 250 cases and go up by factors of \(\sqrt{2}\) (a “half-doubling”):
- Dec. 11: 250 cases/million
- Dec. 18: 352 cases/million (7 days to half-double)
- Dec. 24: 500 cases/million (6 days to half-double)
- Jan. 2: 720 cases/million (8.5 days to half-double)
Conclusion. Looks like there was a slight slow-down but it was roughly constant. I’ll make a slight upward adjustment and go with 2.4 days doubling time, with 70% uncertainty in range of [2, 3.3].
12.4 Putting it All Together
To integrate the information above, let’s assume that the UK gets \(N\) Omicron cases total, currently has \(N_0\) Omicron cases, and that the doubling time is \(t\) days. Assuming that \(N/2\) of the cases occur before the peak, the peak will occur \(\log_2(N/2N_0) \cdot t\) days from now.
Based on the previous sections, I estimate:
- \(N = 6.7 \times 10^6\)
- \(t = 2.4\)
- \(N_0 = 0.2 \times 10^6\)
Plugging into the formula: \(\log_2(N/2N_0) \cdot t = 4.066 \cdot 2.4 = 9.8\) days from now.
That says that cases will peak in 10 days (Dec. 31st). Add 9 days for hospitalizations and 3 days for the moving average, and we get an estimate of Jan. 12th.
Note in comparison that the seasonality estimate would have predicted a slightly later peak, perhaps around Jan. 15th. I do think seasonality should matter, but not as much as the faster dynamics of Omicron. I decided to average these dates together in a 2:1 ratio to get a final estimate of Jan. 13th.
12.5 What’s Next
So far we’ve resolved our highest-priority sources of uncertainty and constructed a reasonable point estimate. But to generate a complete forecast (i.e. a probability distribution over outcomes), we need to assess the uncertainty of our estimate as well. We’ll address this in the next lecture, where we examine: * What assumptions are most likely to affect the estimate significantly. * Which numerical quantities our final estimate is most sensitive to.
12.6 Additional Selected Comments
Misha sent the following general comments:
Some meta issues are being clear on:
- Why do you need this answer?
- What precision do you want?
These are needed to prioritize effectively:
For example, if you are trying to get the best possible estimate, you’d need to think a lot and go into all details about sensitivities and what fraction of hospital capacity was used last time.
If you are fine with an answer within a week or so, you can afford to reserve 2 or even 3 “doublings” for errors in your Fermi estimates. That’s a lot and allows you to forget about specificity.
He also notes:
You probably should be worried about model misspecification. You settled on a nice, clean method for estimating the peak of the next wave. From eyeballing their plot, Delta peaked thrice in the UK — could the second/third peak be higher than the first one for Omicron?